Skip to content
cofiatrading

Glossary

CME Order Flow & Futures Glossary.

All the technical terms you will encounter in CME futures order flow trading, explained in plain English. Each definition links to an in-depth guide where relevant.

Order flow

Footprint

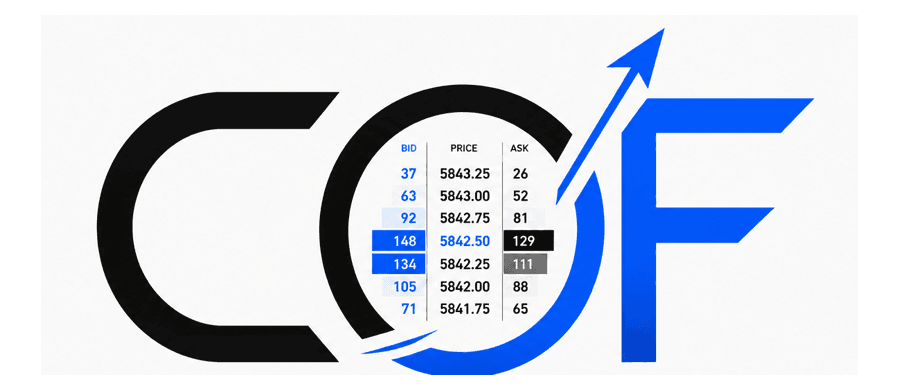
Chart displaying bid and ask volume at each price level.

Also called a cluster chart. Each cell shows bid × ask volume. Reveals directional aggressiveness (delta) at every tick. Standard on ATAS for granular order flow analysis.

Complete ATAS footprint tutorial

Delta

Difference between buying volume (ask) and selling volume (bid).

Delta = Ask − Bid. Measures directional aggressiveness. Positive delta = dominant buyers. Cumulative session delta gives macro sentiment. Delta/price divergence = strong warning signal.

ATAS footprint tutorial

Absorption

Heavy volume on one side of the market without price moving.

Key order flow phenomenon. An institution absorbs the aggressiveness on the other side without letting price advance. Once the aggression is exhausted, price reverses. Powerful reversal signal.

Detecting absorption on ATAS

Imbalance

Significant ask/bid imbalance at a level (ratio ≥ 4×).

When ask ≥ 4× bid at a level (or vice versa). Signals an institutional shove. 3 consecutive levels of imbalances in the same direction = strong signal. Configurable in ATAS (default 300%, pro standard 400%).

ATAS footprint tutorial

VWAP

Volume-Weighted Average Price. Volume-weighted average.

Institutional standard. Pro traders often trade relative to VWAP (long below VWAP in an uptrend, short above in a downtrend). Daily reset at the CME open. One of our strategies (STRAT-01) is dedicated to VWAP reversion.

FVG (Fair Value Gap)

Imbalance zone created by a rapid move without a retest.

Zone between the high of candle N−1 and the low of candle N+1 when candle N sliced through without leaving a trace. FVGs are often retested. cofiatrading STRAT-03 is dedicated to FVG fills.

Order Flow

Real-time analysis of buying and selling order flow.

Trading methodology centered on analyzing who is hitting the market at what level. Based on Market Profile, footprint, DOM, and delta. A deeper alternative to classic candlestick technical analysis.

DOM (Depth of Market)

Order book displaying limit orders at each price level.

Also called Level 2. Shows cumulative bid/ask at each price level in the book. Complementary indicator to the footprint for detecting order walls and icebergs.

Iceberg order

Hidden limit order that progressively re-displays its size.

Large institutional order sliced up so it doesn't appear in full in the DOM. Visible on Bookmap via the liquidity heatmap. Signals the presence of a heavy hitter at a specific level.

Volume profile

POC (Point of Control)

The price where the most volume was traded over a given period.

Central reference level of the volume profile. It is the longest horizontal bar of the profile, the session's psychological anchor. The market statistically revisits it often (70%+ within the next 5 sessions on NQ/ES).

4 high-probability POC setups

VAH (Value Area High)

Upper boundary of the zone containing 70% of the session's volume.

The highest price included in the value area. Considered by institutions as the upper limit of the value zone. VAH breaks with acceptance often precede an upside trend day.

Complete VAH VAL guide

VAL (Value Area Low)

Lower boundary of the zone containing 70% of the session's volume.

Inverse mirror of VAH. Lowest price of the value area. VAL break with acceptance often signals distribution and a bearish trend on the following day.

Complete VAH VAL guide

Value Area

Price zone containing 70% of a session's volume.

Standard inherited from Steidlmayer's Market Profile. The 70% comes from the approximation of one standard deviation on a normal distribution. Institutional acceptance zone — where buyers and sellers agreed to transact heavily.

Complete VAH VAL guide

HVN (High Volume Node)

Profile zone where a large amount of volume was traded.

Cluster of long bars on the volume profile. Price slows down and oscillates there. Institutional acceptance. Useful as a soft support/resistance zone.

Complete volume profile guide

LVN (Low Volume Node)

Profile zone where little volume was traded.

Short bars framed by long bars. Rejection zone. Price moves through it at high speed. They mark transitions between acceptance zones.

Complete volume profile guide

CME Futures

NQ (E-mini NASDAQ-100)

CME futures contract on the NASDAQ-100 index.

Tick size 0.25 pt, tick value $5. One of the most traded instruments by our members. High volatility, very deep liquidity. Micro version: MNQ (tick value $0.50).

ES (E-mini S&P 500)

CME futures contract on the S&P 500 index.

Tick size 0.25 pt, tick value $12.50. The most liquid futures contract in the world. More contained volatility than NQ. Micro version: MES (tick value $1.25).

Tick

The smallest unit of price variation for a futures contract.

NQ: 0.25 point = 1 tick = $5. ES: 0.25 point = 1 tick = $12.50. GC: 0.10 point = 1 tick = $10. The stop expressed in ticks multiplied by the tick value gives the loss per contract.

Position size calculator

Prop firm

Proprietary trading firm that funds evaluated traders.

Widespread model among retail traders: you pass an evaluation (trailing drawdown, consistency rule, profit target), and once validated, you trade a funded account up to 100K-300K. Our STRAT-02 (ORB) and STRAT-08 (Init Flip) strategies are particularly suited to these rules due to their asymmetric R/R. We are not affiliated with any prop firm — the choice is yours.

Platforms

ATAS

Advanced order flow analysis platform (footprint, volume profile).

Professional standard for order flow analysis. Real-time footprint, session/daily/weekly volume profile, cumulative delta, DOM. Compatible with Rithmic for clean CME ticks. Steep 2-week learning curve, then indispensable.

Rithmic

Low-latency CME futures data provider.

CME tick provider used by prop firms and pro traders. Low latency, clean ticks, no delay. Institutional standard for futures data feeds — required by most order flow platforms (ATAS, Sierra Chart, Bookmap).

Risk Management

R multiple (R)

Profit/loss expressed as multiples of initial risk.

If your initial risk is $100 and you make +$250, that's +2.5R. Universal metric independent of size. Allows comparing trades of different sizes. Pro standard.

Sizing tool

Drawdown

Maximum observed loss from an equity peak.

Key risk management metric. Maximum drawdown = maximum observed loss between a peak and the subsequent trough on the equity curve. Prop firms generally impose strict trailing drawdowns, making sizing even more critical.

Missing a term? Let us know at [email protected]